
Introductory Market Metrics in Crypto
Whether you consider yourself a serious investor or a cruder crypto degen, the bear market hasn't been easy on any of us. Watching asset prices tumble 50, 60, or 80% is something that makes the stomach turn and may cause you to question why you are even in this game. Yet in what may seem like an endless pit of despair, opportunity still lurks. One just has to know where to look, incorporating signals that could whiff out a potential short-term play.
At the end of the day, we are all in this space to make generational wealth. Why not dial in while we edge towards the depths of the bear market, learn how to spot, analyze, and capitalize on opportunities to squeak out profits, and accumulate that bag until the next bull run blesses us all?
Within this article, I will dive into a few market metrics and explore their usefulness, analyzing whether they serve as actionable alpha or whether they are simply noise. While I break down each concept, I will let you, the reader, determine its effectiveness. I instead will merely provide the tools to help one make an informed decision on its practicality. The following metrics I’ll explore are market derived, unlike many other indicators that construct readings off theoretical formulas and assumptions. Thus, they should provide insightful knowledge straight from the tap.
Perpetual Funding Rate
Simply put, volatility leads price. Violent moves to the upside/downside stem from the popular use of leverage within the crypto space. Volatility, whether you like it or not, is how traders and investors make money, as without it, there would simply be no price movement. Human nature compels an investor to pile into an asset that is trending higher as the mind succumbs to FOMO. But what happens when too many market participants pile into the same side of a trade?
Perpetual funding rates are a great way to assess the optimism or pessimism present in the market. It can help one determine where the popular trade lies and whether it warrants a contrarian position. But what the hell is a perpetual funding rate?
Starting from the basics, perpetual funding rates are payments made periodically between participants in a perpetual futures market. Okay, so maybe that definition didn’t help much. A futures market is nothing more than a market where traders buy or sell assets at a specified time in the future, for a predetermined price.
In traditional finance, futures markets are hugely popular across commodities, equities, and currencies. The use of such a market allows participants to limit volatility as they are able to lock in a known price today, hedging them at that level until contract expiration (usually at a monthly or quarterly interval.) The buyer must purchase or the seller must sell the underlying asset at the set price, regardless of the current market price at the expiration date. These futures prices often differ from the spot price throughout the contract term, but converge towards the spot price upon settlement. At expiration, the futures price equals the spot price.
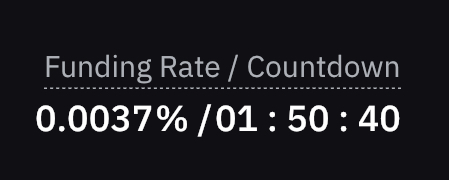
The Funding Rate as seen on Bybit
The difference with crypto, however, is that the lion’s share of volume is centered around the use of perpetual futures. As the name suggests, perpetual futures never expire and continue to trade in perpetuity. The funding rate, as such, was a novel mechanism created to incentivize traders to bring perpetual futures prices back in line with the underlying spot price, closing out any big divergences. Thus, funding rates ensure that futures prices and index prices converge on a regular basis. With the basics now out of the way, we can dive into its practicality and explore how one can utilize these funding rates in forming a thesis.
In times of high volatility, perpetual futures prices can often diverge quite significantly from the underlying asset as traders push prices around via long or short positions. This divergence spills over into funding rates. When prices overshoot to the upside, the funding rate will increasingly tick higher as traders open more and more long positions. To incentivize traders to bring prices back in line with the underlying, a fee is levied in 8-hour intervals on the total notional size of the position.
When funding rates are positive like this, traders with open long positions have to pay short positions in order to keep their trade open. This starts to become prohibitively expensive as more long positions are opened, driving the funding rate higher. The same can be said in the opposite scenario as well, with negative funding rates implying that shorts have to pay longs to keep their positions open.
So how can this be an actionable signal? When the funding rate shoots to extreme levels on either the positive or negative side, it indicates that the herd is overwhelmingly positioned towards one side of the market. And as the famous Stanley Druckenmiller once quoted, “The crowd is usually wrong on the market”. While it shouldn’t be used as an outright signal in isolation, pairing this metric with others can help to formulate a probabilistic scenario of what may occur. The best way to interpret funding rates is to view them from the lens of overbought/oversold.
Where it becomes powerful is when this metric is combined with price action momentum. Due to the fact that traders pay a funding charge (typically in 8-hour intervals), one could logically assume that the trader expects the price to have greater upside than the funding cost he is paying. For example, if price is drifting higher and the subsequent funding rate is +0.3%, then logically speaking, price should be at minimum 0.3% higher over that 8-hour period. Otherwise, the trader is in a net negative position.
Let’s take a look at some examples. (These are cherry picked, extreme examples but it is meant to showcase the overarching point.)

BTC/USDT and its Funding Rate
At the onset of the COVID pandemic, BTC broke to the downside as cascading liquidations pushed price lower. As per the picture above, we can see that the market was overwhelmingly positioned short, as indicated by the deeply negative funding bars. Traders continued to anticipate further downside. Perpetual futures prices overshot to the downside and became very disconnected from the underlying spot, and thus the funding rate went deeply negative. With price starting to stall on the downside, holding a large open short position started to become prohibitively expensive.
As price began to drift upwards, traders who were positioned short near the bottom were now both underwater and paying a funding charge to keep their underwater position open. As price continued to edge higher, traders quickly unravelled their short positions as they started to get squeezed. The ensuing short squeeze subsequently aided in balancing the market and converging the perpetual futures price back towards the spot price as more and more traders closed out their short positions, pushing prices back up.
A more recent example can be seen here with Syntheix (SNX) below. With network activity starting to pick up as the Synthetix team unveiled atomic swaps, price quickly shot higher as traders took note of the increased network activity on the DeFi protocol. As price moved higher, more and more traders began to enter short positions in an attempt to fade the recent price spike. This led to an imbalance of positions in the futures market, with the aggressive number of shorts pushing the perpetual price well below the spot price. A short squeeze ensued as price continued to move against them, propelling price higher as they rushed to close out their shorts (i.e., buy back their position). This led to an explosive move to the upside, with price more than doubling in a few short days.
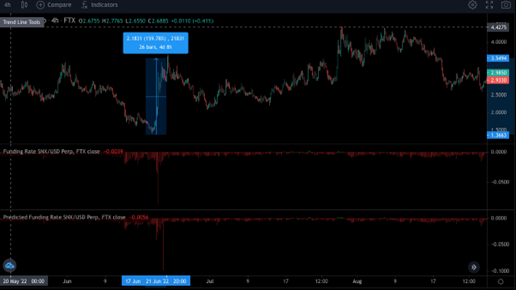
SNX/USDT and its Funding Rate
Perpetual funding rates become more actionable when the interest paid on open positions becomes extreme due to the inherent funding costs being paid out on levered positions. As such, funding rates are a worthwhile metric to add to one’s arsenal, as it can help peel back the layers of market positioning.
Open Interest
The next market metric of relevance we will discuss is open interest. Layering in the open interest metric with funding rates can provide even further insights, helping one to dissect market sentiment and frothiness. To start, open interest in the futures market is simply the total number of open positions held by market participants at any given time.
Open interest can be used as a proxy for demand. As more capital enters the system, open interest increases. As capital flees, open interest decreases. For this reason, increasing open interest is often considered as one of the many factors that can serve as confirmation of a bull market, whereas decreasing open interest signals a bear market.
Tying it back to funding rates, OI can be viewed as a proxy for demand for the perp product while funding rates can serve as a proxy for where that demand is positioned (e.g., high positive funding would suggest demand for leveraged long positions). Let’s take a look at an example below:

Funding Rate, Open Interest, and BTC/USDT
Area 1
The first section of this chart can be annotated as a bull market. Price is rising and more money is entering the system to participate in the move (as seen by rising OI), with the majority of that demand being for levered long positions (as seen by positive funding rates). In this scenario, traders are willing to pay a premium to increase their exposure via leverage. In a case like this, the market believes the price of BTC will go up, and it wants to profit from that as much as possible.
Area 2
The second section of the chart is where the price momentum starts to stall. Given the buildup of levered longs and the overall amount of exposure present in the market, highly positive funding rates start to eat into the profits of long traders. The lead up to this stage can be characterized as somewhat euphoric, as more and more traders look to capitalize on upside price swings. Small drops in price, however, can quickly lead to sharp market reversals, given the extent of levered long positions. These drops in price can quickly lead to liquidations and what is often referred to as a “leverage flush out”. These scenarios can be characterized by a large drop in OI, reversal in funding rates from positive to negative, and a subsequent violent drop in price.
Area 3 & 4
As the market begins to recover and prices resume their uptrend, traders become euphoric once again and re-enter the market via levered long positions, although to a lesser extent this time. Healthy bull markets typically see greater participation via increasing OI. As price reaches a new all-time high in Area 3, notice how OI is still well below its previous highs set back at the prior all-time high. While the market is still primarily positioned levered long, as seen by positive funding rates, the same level of frothiness is not present in the markets this time, as participation in the move – measured by dollar exposure – is much lower. Nevertheless, as prices begin to revert and levered long positions go underwater while paying funding, the same process plays out once again: flushing out the bulls, with funding rates briefly dipping into the negative.
When used in combination, OI and funding rates can help one dissect the frothiness in the market and determine how that demand is being expressed. Adding these two metrics to one’s tool kit can help a trader formulate a thesis and position themselves depending on their interpretation of how “hot or cold” the market currently is. All of the above applies to downside scenarios as well, only with inverse readings.
Bitcoin Futures and Term Structure
The last and final metric we’ll discuss within this article incorporates another piece of data extrapolated from the futures market, the futures term structure. In plain English, the term structure of futures contracts is simply the price curve formed by the prices of futures contracts over various expiration months. It is the relationship between the price of an asset now versus the implied price of an asset in the future. Given that the term structure is derived from future prices for the underlying asset, it can be a useful tool in gauging the overall market sentiment and its interpretation of where traders see prices going over the short/medium term.
Futures, unlike perpetuals, have an expiry, one that causes the price of the future to converge towards spot. Keeping things simple, there are generally two different structures a futures curve can take: upward sloping and downward sloping.
An upward sloping curve is visualized as futures prices across various expiration months trading at a premium to spot, thus creating an upward slope. This is known as contango.
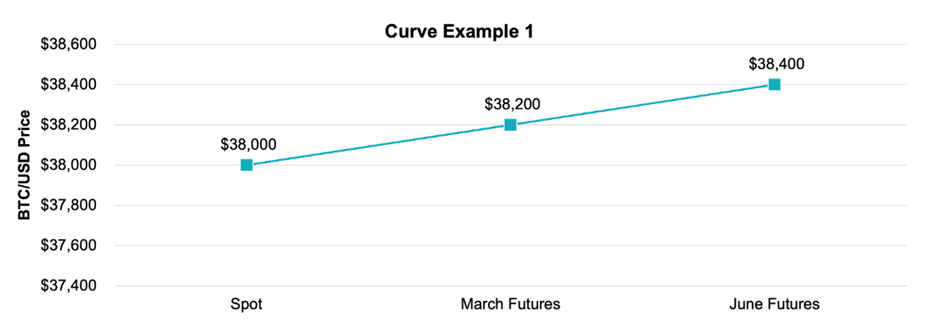
Contango in BTC Futures
A downward sloping curve is visualized as futures prices across various expiration months trading at a discount to spot, thus creating a downward slope. This is known as backwardation.

Backwardation in BTC Futures
So, what can the shape of these curves tell us? When investors are bullish and want to leverage long, this will drive up the price of futures away from spot. This increases the steepness of the curve. An increasingly steep curve suggests demand for leverage is high as traders look to express a bullish long position. The spread between any future price and the spot price is the ‘cost’ investors are willing to pay to access leverage. This is because when you buy a futures contract, you essentially borrow money today to purchase an asset that you will receive in the future.
During times of market frothiness, futures prices can dislocate quite materially from spot. This dislocation can be referred to in either direction as “richness” or “cheapness,” and the best way to compare it across differing futures contracts is to calculate the annualized basis. The same can also be said in scenarios when sentiment is bearish. The futures price will fall below the spot price as investor demand to go short increases.
Now, while trading futures and basis is a whole different strategy in it of itself, we are merely going to focus on how one can use this metric to gauge overall sentiment when paired with the previous two metrics. Picking up where we left off when we looked at perpetual funding rates and open interest, we can also layer in futures term structures to get a more holistic market view. In situations where the market is moving sideways and we have a (+) or (-) basis (contango or backwardated term structure), this can help us identify what side of the market is entering positions more aggressively.
- When there is increasingly positive funding, open interest is rising, and futures trading at a high premium, it shows longs are becoming crowded and demand for leverage on the upside is extreme as traders turn euphoric
- When funding is increasingly negative, open interest is rising, and futures are trading at a deep discount, it shows shorts are becoming crowded and demand for leverage on the downside is extreme as traders turn pessimistic
- Note: open interest does not need to be rising in each scenario. Rising OI merely indicates new capital is entering the system.

Futures Term Structures of Assorted Exchanges
Back in April of 2021, markets were trading in a state of euphoria, with bitcoin’s three-month futures premium reaching eye watering levels. The 3-month rolling basis reached 30% + annualized. At the time, spot was trading just shy of $60k (59,600 to be exact). With prices hovering near all-time highs, the market was overly optimistic, with popular terms such as “up only” and “see you at all-time high” being commonly thrown around.
As the overwhelming majority of market participants were bullish, and thus long, demand for long leverage also grew, with retail driving up the futures basis. The frothiness, or richness, could easily be derived from the futures term structure alone, with a 3-month future netting a basis trader 36% annualized (() – quite a return for a 3-month position. The extreme contango of the market near all-time highs, however, would eventually mark the top, with prices quickly reversing to the downside following a major leverage wash out.
Conclusion
Getting a gauge on overall market sentiment and positioning can allow one to front run potential “leverage flush out” scenarios, which we are all too familiar with in crypto. These occurrences happen quite frequently in this market due to the high level of leverage used by market participants. Paired with other metrics or signals, these market derived indicators can help one spot if there is frothiness or extreme pessimism in the market and can give a glimpse as to how traders are positioned.
To requote the legendary Stanley Druckenmiller, “The crowd is usually wrong on the market.” When one side is overly crowded and everyone on crypto twitter is screaming for new all-time highs or lows, it becomes absolutely essential to have a pulse on where these metrics lie, as it can save one from a severe drawdown and avoid piling in with the herd. No one ever went broke taking profits, and being able to pre-position yourself ahead of a potential leverage flush out will only help make you stronger in this game.
Published on Oct 03 2022
Written By:

Leveraged Degen
@LeveragedDegen_