
Liquity: Q3 Quarterly Report 2022
Key Insights
- Liquity moved in tandem with similar protocols in Q3, which saw reduced borrowing due to a decline in long leverage
- An increase in other metrics like the number of active troves and stability pool utilization highlighted LUSD’s unique desirability in a market downturn
- The much-anticipated Chicken Bonds program was released in Q3, offering protocols a system for bootstrapping liquidity at low cost
- Liquity kept away from recovery mode and LUSD maintained its peg, reaffirming the robustness of protocol design in the face of bear market headwinds
Introduction
The DeFi space received little relief in the third quarter of 2022, with a continuation of poor market sentiment extending the drawdown of risk assets we saw in Q2. Similar to other lending protocols, Liquity experienced a decline in borrowing as a result, though other metrics like the supply and peg of LUSD reflected remarkable stability in the face of market turbulence. In addition to this, a rise in the number of active troves and LUSD utilization by the stability pool highlighted Liquity’s unique value as a conservative destination for sidelined capital in times of unrest.
For these reasons and others which will be explored within this report, LUSD traded at a premium to other stablecoins throughout Q3. Most importantly, the Liquity team worked diligently over the quarter to build new products, and the newly launched Chicken Bonds protocol will be explored in detail in the last part of this report. First, we will look at the key metrics surrounding Liquity’s health and usage in Q3, with a particular focus on exploring the aftermath of Q2.
Usage Metrics
LUSD Supply

Total LUSD Supply
Total supply stabilized in Q3 after declining over the first two quarters of 2022, hovering around 170 million LUSD. Approximately 3 million LUSD were burned through redemptions over the quarter, with ~16 million more through liquidations and ~412 million through repayments. These burns were largely balanced out by minting, resulting in a relatively stable supply across the quarter. This was consistent with other collateralized stablecoins, with the supplies of DAI and RAI remaining similarly flat at 1.5% and 2% growth.
Open Trove Count

Number of Troves
Trove count recovered in Q3, growing from 504 to 646, making this the first quarter of the year with a net increase in open troves. Once again, the ETH dump in June was the main factor behind the reduced number of troves early in the quarter, but we can see that numbers are steadily climbing up as funds flow back into ETH.
Daily Borrow/Repay Volume
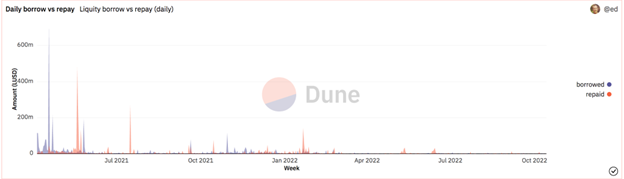
Daily Borrow vs. Repay
With the amount of uncertainty we’ve seen in the markets recently, it’s unsurprising that borrow/repay volume was generally modest over Q3. This is due largely to the lack of appetite for long leverage on ETH, one of LUSD’s primary use cases. Ever since June saw ETH crash down to $800 and trigger an onslaught of liquidations, leveraged ETH exposure has been an unpopular trade.
Revenue

Protocol Revenue
Moving on to protocol revenue, we again see growth subdued in the aftermath of Q2. Cumulative revenue is up $1.7 million since last reported at the end of Q1, so Quarters 2 and 3 combined saw less revenue than the ~2 million brought in during Q1. Tempered numbers like these are to be expected with a reduced appetite for borrowing, as borrowing fees generate the majority of protocol revenue.
LQTY Staking APR

LQTY Staking APR
These effects are also reflected in the LQTY staking APR chart. Yield over the quarter hovered in the range of 2-13%, compared to the strong double-digit yield which was generated during the bull market of late 2021 and into early 2022.
Health Metrics
Total Collateral Ratio

Total Collateral Ratio vs Eth Price
The Total Collateral Ratio (TCR) rose significantly in Q3, reaching the highest levels of the year in August and subsequently resuming its correlation with ETH. Near the end of Q2, the rapid drawdowns in ETH price caused an unusual divergence between the two metrics, as TCR shot up while ETH price tanked.
In previous quarterly reports, it has been noted that these flips are indicative of market sentiment shifts. The inverse scenario of ETH flipping TCR was last observed in August 2021, marking a return of major risk-on dynamics and increased usage of LUSD for leverage. With TCR remaining above the ETH price line for multiple months, it's safe to say that markets are now steadfast in their risk aversion. After ETH price stabilized somewhat from the ~$800 lows, TCR resumed moving in tandem, all the while remaining healthily above the 150% Recovery Mode threshold.
Liquidations

Weekly Liquidations
This brings us to the Liquidation metrics, where we can see that the dust is still settling in the aftermath of over 100,000 ETH being liquidated in June. Liquidation numbers reverted to relatively low levels in Q3, however, with the highest weekly total being slightly over 200 ETH in mid-September.
Stability Pool APR

LUSD Stability Pool APR
Liquity is designed in such a way that all liquidations are purchased by a standing Stability Pool, so a greater volume of liquidations means depositing in the pool will be more profitable. The next chart reflects this by highlighting the difference in APR between Q2 and Q3.
Since the pool allows LUSD depositors to accumulate the ETH liquidated from troves, returns were enhanced at the end of Q2 by the large intake of cheap ETH. Liquidations were fewer in Q3, so the pool’s APR fell back down to under 10%. This is the nature of the stability pool: a conservative play for low to decent yields, with major upside during periods of high volatility.
LUSD Utilization Breakdown

LUSD Utilization
In terms of LUSD utilization, the Stability Pool was still the top destination for LUSD in Q3. Over 60% of circulating LUSD resided there at the end of the quarter, up from 40% at the end of Q2. Synthetix, Optimism, and Curve continued to be the other largest users of LUSD, while Fei depleted their reserves to repay the victims of an April hack.
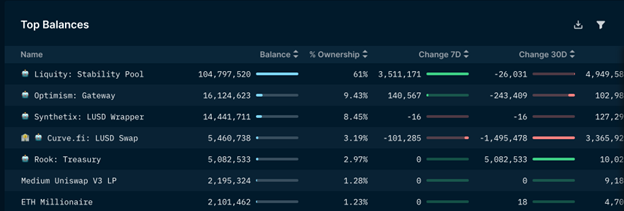
Top Balances
Also notable in Q3 is the growth of the “unknown” utilization of LUSD to ~12% of supply. It appears the treasury of MEV-focused Rook protocol is one of the larger holders in this category, alongside some whale wallets.

Q1 User Activity

Q3 User Activity
Orange = borrows. Purple = stability pool deposits. Gray = borrow and deposit
Looking at the overall breakdown of LUSD user activities, we can see that depositing to the stability pool (purple) has become the most common strategy. This is a departure from Q1, when borrowing (orange) was the dominant activity, another indicator of the shift to a risk-off market strategy. When users are only borrowing, they are most likely using LUSD for long ETH leverage, and when the market is buying LUSD to deposit in the Stability Pool, they are instead looking for low-risk yield.
LUSD Price Stability

LUSD Exchanges Rates
LUSD remained well within the soft peg range of 1.10 over the quarter, though it has been trading at a premium to other stablecoins for an extended period of time. One plausible explanation for this scenario is the heightened awareness surrounding centralization risks, as USDC/USDT have been known to blacklist wallet addresses and DAI currently relies on USDC for over half of its reserves. Treasuries and individuals seeking censorship-resistant assets may be willing to pay a premium to swap to LUSD from any of those three stables. As a reminder, LUSD is designed to trade within this range due to the minimum collateral ratio of 110%, so there is no arbitrage opportunity presented for either minting and selling or market buying and redeeming.
Metrics Summary
Due to poor market conditions, the overall volume flowing through Liquity declined, slowing revenue growth as a consequence. Even with the price of Ether down 80% from ATHs, however, Liquity functioned uninterrupted, attesting to the resilience of the systems it has in place for maintaining peg and solvency. Stability Pool deposits increasingly dominated LUSD usage, as risk off strategies were more favored as opposed to ETH leverage. Trove count increase was another bright spot, as numbers have slowly recovered from June lows.
Ecosystem Growth
Optimism
Aside from raw protocol metrics, a look at LUSD adoption in different areas across DeFi can paint a more complete picture of its value. Over Quarters 2 and 3, Optimism has been a focal point of such adoption, with its main DEX Velodrome and major player Synthetix both utilizing LUSD extensively.
Upon its launch in June, the Solidly-style AMM Velodrome needed to bootstrap liquidity for its pools. The team selected a handful of protocols on Optimism for an airdrop of veVELO, the locked governance form of their native token. The purpose was to form synergistic partnerships with these protocols, allowing them to take part in revenue sharing and incentivizing them to supply bribes for their pools to attract more votes and subsequent LPs.
As one of the selected protocols, Liquity has established LUSD as one of the top options for stablecoin liquidity on Optimism, frequently participating in the bribe system and building up a 4.4 million veVELO position. Overall, ~15m LUSD currently resides on Optimism, representing 9% of the total supply.

Top LUSD Pools on Velodrome
As can be seen above, the sUSD/LUSD pair is one of the deeper pools on Velodrome. Synthetix initially integrated LUSD for the purpose of strengthening the sUSD peg on Optimism, and it remains one of the top users of LUSD today. As a fellow recipient of Velodrome’s airdrop, Synthetix also plays a major role in the bribe ecosystem, often offering up bribes to deepen sUSD/LUSD pool liquidity.
The combined efforts of Liquity, Velodrome, Optimism and Synthetix have resulted in sUSD and LUSD both becoming top 5 stablecoins on the network.
Finally, Q3 also saw LUSD continue its foray into Optimism with a new integration with the Angle Protocol. Angle is an overcollateralized stablecoin protocol that operates two products on Optimism and the Ethereum mainnet - Angle Core and Angle Borrowing. The latter allows users to deposit stablecoins as collateral, which can then be borrowed against for leverage in its agEUR, a stablecoin pegged to the Euro. AIP-22 proposed to add LUSD to the protocol as a form of collateral, and passed unanimously on September 3rd.
Chicken Bonds

Chicken Bonds
Finally, Q3 saw the release of Liquity’s much-anticipated Chicken Bond program, a bonding system built on game theory principles and utilizing dynamic NFTs that evolve according to decisions made by the holder. The purpose behind the project is to enable protocols to bootstrap liquidity at a low cost, and offer better protection to those providing liquidity with a unique bonding model.
How Chicken Bonds Work
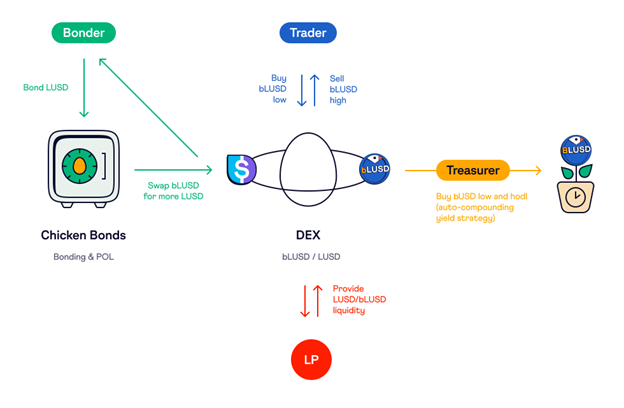
Life Cycle of a Chicken Bond
The new system is first being deployed for use with LUSD, so users will need to accumulate the stablecoin in order to create a Chicken Bond. From there, they will be able to bond LUSD to receive the derivative token bLUSD, which can be done through a Liquity frontend. bLUSD earns amplified yield compared to LUSD deposited in the Stability Pool, and is also auto-compounded.
Once a bond is created, an NFT will be generated to represent the position, starting out in egg form (pictured above left). While the bond is held, it will continue to accrue bLUSD, and holders have the option to either “chicken in” and claim those tokens, or “chicken out” and reclaim their LUSD principal.
Since CBs have no maturity duration, these actions can be taken at any point in time, and each decision results in an evolution of the associated NFT (pictured above center, right). Since bond positions are represented by the received NFT, they can be traded on a marketplace such as X2Y2 and LooksRare. However, bonds cannot be traded for 24 hours after a chicken in or chicken out, ensuring that marketplaces have time to update according to the new state of the NFT.
While bLUSD yield is more lucrative than LUSD yield, it is not without risks. While the principal is initially protected by the ability to chicken out, a bonder foregoes this option upon chickening in and claiming the accrued bLUSD. Unlike LUSD, bLUSD is not a pegged token. Instead, its value is derived from the expected future yield and is backed by the system’s Reserve. The Reserve consists of LUSD and yTokens for the Yearn Curve LUSD Vault. bLUSD can be redeemed in exchange for a mix of these tokens, the amount of which is proportional to the amount of bLUSD redeemed. For example, redeeming 5% of the total bLUSD supply will earn the redeemer 5% of the assets in the Reserve.

Chicken Bond Yield
Lastly, a note to clarify where this amplified bond yield comes from, as well as how the system deepens protocol-owned liquidity:
All LUSD that flows into the system through open bonds and chickening in is deposited by the system to either the Stability Pool or the Yearn Curve LUSD vault. The yields generated here are harvested and autocompounded, and flow to the CB system Reserve. This means the LUSD amount in the Reserve grows faster than the natural rate at which LUSD compounds, and since bLUSD can be redeemed for a portion of the reserve as explained above, holders are entitled to their share of this enhanced yield upon chickening in. As for holders who chicken out, the accumulated yield they forfeit also flows to the reserve, further boosting the redemption value of bLUSD.
On the protocol side, once a bonder chickens in, their LUSD principal becomes protocol-owned. For Liquity, that means it is used either to deepen the Stability Pool or to tighten the $1 peg on Curve, as it is the main marketplace for LUSD. The division of LUSD between these two destinations is designed so that LUSD only flows to Curve when it will improve the peg.
Chicken Bond Metrics
Bond utilization is off to a healthy start, with over 650 eggs laid to date and nearly 10 million LUSD accumulated by the treasury. As intended, the 12.43x amplification multiplier applied to bond yield has resulted in a significantly higher return than that of the Stability Pool. The majority of bonds are currently in a pending state, meaning their bonders have yet to chicken in or out, a number which will be interesting to monitor as bonders develop their optimal strategies. As for the bLUSD/LUSD Curve pool, it currently contains 750k bLUSD and 1.015 million LUSD - a total of $2.1 million TVL and a strong start for bLUSD liquidity.
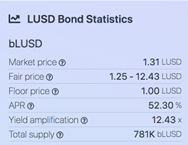
LUSD Bond Statistics

Statistics

Treasury
For a highly detailed explanation of the entire system please refer to the CB documentation and blog.
Conclusion
While market conditions in 2022 have been far from growth-friendly, Liquity has remained in good health and continued to function as intended, independent of ETH price and risk appetite. The coming months show promise in terms of LUSD adoption, as the importance of decentralized stablecoins becomes increasingly apparent. As layer 2 adoption continues to grow, LUSD has become a top 5 stablecoin on Optimism. This past quarter also saw the introduction of Chicken Bonds, an innovative system for liquidity bootstrapping that further integrates NFTs and DeFi. To learn more check out the Docs and Blog, and join Liquity on Discord, Twitter, and Telegram to get involved with the community.
Published on Oct 25 2022
Written By:

Rxndy444
@rxndy444