
Macro Deep Dive: September
It's been a couple of months since my last report, so I’m packing this one with a bit of extra punch. In this macro update, I’ll be recapping the past couple of months, examining how closely they matched my expectations, and forecasting where I see us going forward.
Key Points
- New orders have followed the ISM index on its path to the downside, adding another data point to the recession case
- While the Fed and media claim that jobs data point to a strong economy, employment is a lagging indicator and doesn’t tell us anything about where things are headed.
- Geopolitical tensions continue to drive up the price of crude oil, and underinvestment in refining will put constraints on fuel supply, exacerbating inflation
- The Fed’s late start on QT has them hiking into a recession and will likely force Powell to choose between severe economic pain and 70’s style stagflation
- As the cost of living continues to rise relative to real wages, his hand may be forced in the hawkish direction
- This all adds up to a bearish short-term outlook with September living up to its reputation as an ugly month for the markets
Nowcasting: Recession Vibes
PMI
In my June report, I noted that the inventory glut indicated by the massive drop in ISM manufacturing expectations has set the tone for this market cycle. As we can see below, new orders have followed suit.

ISM + Empire Manufacturing Survey
In fact, ISM numbers are down around the globe, and leading indicators are building momentum for the recession case.

ISM + % of Countries with Rising OECD Composite Lead Indicators MoM
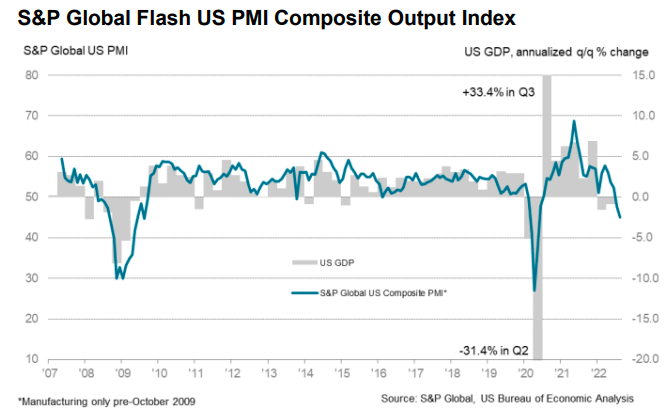
S&P Global Flash US PMI Composite Output Index
The media has not been touching on the importance of inventory orders, so I’d like to reiterate what exactly this means. Inventory orders from purchasing managers show their expectations of demand going forward and leads the market in forming future expectations. These PMI readings have rarely been this bad other than at times when recessions were around the corner. Generally speaking, the ISM has been the first shoe to drop before everything else began to collapse. This is why it's important to watch to get a gauge of where we are at in this market cycle.
It is abnormal to be getting headlines like these only a year after bragging about a client base being unaffected by pandemic swoons. Truly reiterating the speed at which this market is moving.
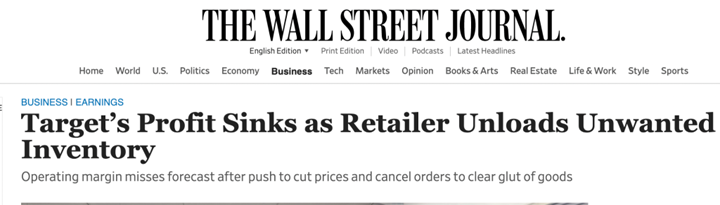
Source: WSJ
The cliff notes: Target’s earnings fell 90%, while Walmart’s rose. Walmart is truly the winner when stress is placed on consumer wallets. A large portion behind Target’s dramatic earnings loss is that they had severely misjudged consumer demand, overstocked their inventory, and had to discount their products to move size like an absolute unit. I think the lesson here is don't jump the gun on attributing your success without ruling out that you might just have been on the lucky side of the cycle. (cough cough Do Kwon).
Businesses whom previously were benefactors of the lockdown now have the pendulum swinging the other way as it turns out they were really a discretionary purchase now that times got tough. Further indicating that the average consumer’s wallet is being affected thanks to the elevated cost of living.
Jobs Jobs Jobs
The Fed and mass media continue to point to jobs data as evidence that everything is fine, but I’d like to clarify that the employment and jobs data is a bit misleading. Here’s why:

Source: St. Louis Fed
The chart above shows total non-farm employees (we use non-farm workers since farm hands tend to increase during recessions, and decrease during expansion. No one wants to be a farmer when there are plenty of jobs elsewhere.) Something that clearly sticks out is that we are just NOW recovering the jobs that were lost due to the COVID lockdown. Wanna take a wild guess what areas those jobs are in? Here’s a hint from this months jobs update:

Monthly Jobs Report
If you guessed Amazon/Fedex drivers and hotel concierge/waiters/pilots, you would be correct. Funny thing about the leisure industry, it was also the industry that was impacted the most by the COVID shutdowns with layoffs. Workers in these industries have come back to their jobs at new inflationary wages.

Median Pay Change by Industry (August)
The irony in this chart is that with inflation at 8.5%, this means the only industry that has natural wage inflation is the leisure and hospitality sector. And if you think that its sustainable, here is a quick case study based on United’s earnings:

Source: United Earnings Report
Even though their revenue per employee increased during the past two years, once you compare it to the nearly 40% drop in operational profit per employee, we can see that the primary driver of this has been the inflated energy and travel costs that were passed down to customers. Lastly, you can see that wage inflation is in full effect.
So let's look at this through a CEO’s eyes. If we wanted to improve our operational margins, what are our options?
- Jack prices up further at the risk of decreasing demand further
- Hope that expenses will come down and for headlines like the one below to increase thanks to upcoming holiday travel (the soft landing fantasy)

Source: ABC News
Or finally,
- Fire the employees
This is a no win scenario for the travel industry and makes these job numbers a terribly misleading for politicians and the media to use as an indicator of economic activity. Let it be known, that the devil is always in the details.
Don't Forget About Oil
Oil has been rather sticky at this price range of 95, which is indicative of the supply and logistical constraints currently facing the industry.

CFDs on WTI
If you hadn’t noticed, America’s investment in the oil and gas industry has dwindled over the last two decades in favor of greener options thanks to the rise of ESG. The most recent large-scale refinery to be constructed here was funded back in the early 2000s and just finished completion earlier this year. While the Biden administration may brag about all the oil reserves we have, it's pointless to talk about these figures without differentiating what type of reserves we’re sitting on.
In the oil industry there are two general types of oil:
Crude: What is pulled straight from the ground
Refined: Crude oil that has been processed into a usable form (everything from gas, asphalt, make-up, etc).
What Biden often quotes are the crude oil numbers, and while these may seem impressive, crude really doesn't matter as much as refined because it isn’t usable. And if one were to go off of crude numbers, the next area to check in on would be the refining capacity.

US Refining Capacity
Ironically, this has been dwindling since 2020 and is projected to continue doing so, as there are several major refineries scheduled to close during 2023. For context, refineries can produce between 4,000 - 300,000 barrels per day. The refineries closing up shop in Louisiana produce roughly 263,000 barrels per day.
If you are wondering why we are reducing our number of refineries, look no further than the ESG and green agenda pushed by the WEF (World Economic Forum). I point the finger at the ESG initiative because it has been actively used as platform to demonize and divert investment from the current energy infrastructure in a fair and practical way. Their goal is to eliminate dependence on the fossil fuels industries by 2030. In my opinion, this is a rather unrealistic goal for three reasons:
- Currently, global energy produced from renewables sits at roughly 20 - 25% with fossil fuels making up the remainder.
- The required infrastructure to store, generate, and deliver the power is just now being invested in and would take 20 - 30 years to build out, not 8.
- The countries that primarily rely on fossil fuels are not western nations. Thus, to achieve full independence from the fossil fuels industry would require significant investment in the infrastructure of non-western societies. (side note: the US currently gets 87% of its energy through the fossil fuels industry).
Source : Fossil Future by Alex Epstein & C2ES
The overall effect of these policies has left Western society in a structurally unique situation. First, the lack of infrastructure investment has left the US in a state of increased dependency on imported products, making it acutely sensitive to geopolitical risks between its trading partners.
Second, this lack of refinery infrastructure has downstream effects on the price of gasoline, heating oil, and other oil-based products that will establish floor prices. This means that the “inflated” numbers we are seeing in crude are primarily due to structural inflation rather than a monetary phenomenon. Additionally, foreign powers like Russia could withhold production, forcing trading partners like Germany to compete with the US over Saudi oil.
The Russian factor will constrain the Fed’s actions against inflation by changing the supply dynamics. What the US may have in its pocket, though, is a potential side deal with Iran, which could immensely lower crude costs. In order to get that, however, the US will need the Israelian government’s permission before any deal can be struck. And we all know the tension between Iran and Israel will make that exceptionally difficult.
Cycles Cycle
Moving on, the narrative of our economy running on all cylinders is falling apart before our very eyes. We are not in a strong economy and I would actually argue that we are in a completely new type of economy that a majority of Wall Street and politicians haven’t considered. We can see that based on their expectations going into Jackson Hole of rate cuts over the next 9 months.

ISM + Percentage of Central Banks Cutting Rates
The Fed’s talk last Friday sent a humbling message to markets: inflation is bad, and Powell wants to be this generation’s Volcker. The question is whether or not Papa Powell has the balls to hike rates into a recession and face the inevitable political backlash.
To preface, there has only been one Fed chair who hiked into a recession, and that was Volcker. He hiked rates until he saw inflation’s eyes roll back in its head, and treasury rates went as high as 16%. Because of these actions, the US faced back-to-back recessions.

S&P 500 (1W Chart)
It was an effective yet brutal approach to calming inflation. Since Volcker, however, no other Fed chair has ever attempted to hike into a recession. Doing so would cause massive political pain for Jerome Powell down the road, and I believe he will ultimately cave to that pressure. Let me explain:
It's clear the Fed should have started hiking earlier, and I would argue that they should have been hiking back in Feb/Mar of 2021, when the rate of change in the spread between junk bonds to investment grade began increasing 600bps - 800bps per day. The pandemic was almost over, people were beginning to be sick and tired of being cooped up, and it was clear that many companies were profiting. The market was asking for a rate hike, because it could take it. Powell didn’t however, and this was fueled by his desire to keep his job, as his reappointment was up for grabs. Powell caved to political pressure to maintain his position rather than do what needed to be done.
Note: If you’d like to read more on the inner mechanisms of the federal reserve, check out @DiMartinoBooth on Twitter, she’s a former fed member, and much of her writings follow the political gridlock in the Fed and its effect on the economy.
So instead of beginning the hikes when he needed to, Powell hiked late. What's more is that the tone of the Fed talks has shifted over the past year from being proactive to “data dependent.” This is essentially saying “I’ll wait for the lagging indicators to confirm the trend so I don't have to face backlash on premature policy choice.” By being data dependent, specifically on job data, the Fed is forced to hike through the mass signals of recession until their lagging metric of employment gets affected. The question is, is unemployment or inflation worse?
The Danger of Inflation
Many of these Harvard economists at the Fed seem to be having a difficult time communicating the answer to this very question. So for those of you who still do not quite understand, I’ll take a crack at it:
Human nature is very much like a pressure cooker. Every so often you gotta let out some steam, otherwise, it builds to a dangerous situation. When your cost of living is more than you make, people get upset. The continued pressure on wages eventually causes a tipping point at which people will naturally let off some steam the only way they know how: revolt.
Now this is usually the extreme end game, fall-of-an-empire type of situation, but a major part of the Fed's actions over the past 40 years has been a balancing act of depressurizing the economy to keep this from happening. I am seeing more signs of this kind of situation rising however.

Real Pay (UK)
Above is the cost of living in the UK relative to real wages. Real wages are officially worse than they were in ‘08. Many people, especially boomers, who lived through ‘08, know the deal was completely unfair in how the very banks who caused the situation got bailed out while pensions and such were completely decimated. The inequity is what originally gave rise to Bitcoin.
This in context of the jobs and oil data have Powell in a position that very few Fed chairs have found themselves in. If he continues hiking, it will plunge the US into a potential financial depression (6 quarters of negative GDP), committing political suicide. On the other hand, if he eases off by even pausing, this will push the market into a stagflation cycle it hasn’t seen since the 70s.
The Effect on Crypto
As I’ve mentioned before, crypto has never been through a global slow down, so it will be interesting to see how this plays out. One thing I know for sure is that blockchain technologies will play a role in the future of finance; recessions have a way of weeding out old technologies to make room for newer ones to expand. My thoughts on this are that we will see the rise of Web 2.5 rather than Web 3.0.
A major hurdle for many industries is that the jump directly into crypto is just out of reach; the amount of infrastructure alone would take at least 5 years to develop. But I see quicker adoption of 2.5 technologies, (Goldfinch, Maple Finance, real yield protocols) since the mental hoops to jump through from a business standpoint are a bit closer to the ground.
Thoughts on The Merge
With the Merge on the horizon in September, I know this is a question many readers may have. To me, this event has become a 0-sum game. This is one of the largest transfers in crypto history for protocol wealth from one chain to another, and the stakes are high. The Dan Robinson article, Ethereum is a Dark Forest never hit harder.
I would be remiss to think that professional hackers are overlooking this opportunity, you can bet we have people trying to find ways to take advantage of any faults during the merge. So how I value this situation is very much like anyone who professionally gambles, limiting the potential for losses while still being able to participate.
It is my hope this goes off without a hitch, but I am not going to bet the moon on it without any protection in place. Expect some serious volatility and high funding rates on exchanges as we approach the merge.
Predictions:
Review of Prior Calls
Over these past couple of months, I was calling for risk on rally through August and potentially facing some chop towards the end as August is historically a flat month for markets. What we saw through July and August was just this, a risk on through the majority of August until a turnover around August 18th, when market makers began selling their positions to adjust for lower levels to come. If you caught this hedging move by them, then you would have had one hell of a month with the S&P and BTC looking to close down ~3.5% and ~14% respectively this month's end.
However, this selling went a bit further than my expected downturn of -0.7% for S&P, and I believe much of that is attributable to the leverage that has been introduced into the economy thanks to the excess liquidity on hand. I would like to note that markets today are moving at velocities that are higher than the norm, and this should be accounted for.
So now let's hop into the real juice; below and on a go-forward basis, every Macro report will include my outlook over different time frames to give the context to the framework I use in approaching markets.
Short Term: 1-6 Months
After this August rally, we are looking at a rather ugly September for the S&P 500, which is historically a down month (-1.7%). But with the four day weekend, you can expect some short covering to potentially occur, since volumes will be lower than normal, so don’t get sucked into the bull trap expecting it to continue. We have another CPI reading coming up, and I expect it to be flat or increasing; this is primarily because oil is sticking to its 95 range like white on rice.
The longer Americans and the global world are forced to pay higher energy costs, the less money they’ll have to spend elsewhere, which continues to drag down expectations further. Along with this, we have the next Fed meeting where they are predicted to cut rates by 50bps. As I mentioned earlier, the Fed will stick to this hawkish scenario based purely on market data. If they are going to fight inflation, they will continue hiking in the face of this recession, sacrificing the market to slow demand. This will only bring more pain into the market, and Wall Street does not have this priced in. The Jackson Hole talk showed just how little this was actually priced in as well, when the market reacted as poorly as it did.
Long Term: 6-18 Months
Nothing has fundamentally changed as far as this goes. As you may have picked up, I am pretty bearish on the economy overall. My personal view on the market is that we are due for a 2 -3 year global slowdown, but I’d like to qualify this by saying that I started counting in January of 2022:
- Europe is galloping towards an energy and food crisis made only worse by governments not actually thinking about logistics and instead trying to check boxes around ESG matters.
- China is getting smashed by its housing market, which makes up more than 30% of the economy’s GDP, and 70% of its people’s retirement.
- The US is dependent on foreign oil because they haven’t invested in onshore oil refineries as much as it should have over the last 2 decades and thus limiting its geopolitical power with other nations without getting violent.
- The Fed hiked late in the cycle and is now facing the repercussions of it. Expect them also to pivot late.
- Continued polarization in the US will make progress towards a common goal difficult without some sort of traumatic intervention.
- Under-investment in modernizing current energy infrastructure due to political lobbying and agenda-pushing misinformation.
I would like to note that should the Fed pivot or ease on the hikes, you can expect us to enter into stagflation, then a recession, and should they continue to hike, we’ll just rip the bandaid off and enter immediately into a full-blown depression. The key here going forward is whether the Fed has what it takes to do its job or if they bow to political pressure and prolong the pain and recovery.
Published on Sep 02 2022
Written By:

blk_7wan
@blk_7wan